HealthyR: R for Health Data Science
This module includes excerpts from the book “R for Health Data Science” by Harrison and Pius, reproduced here with authors’ permission.
![]()
Why we love R
R can be used for all the health data science applications we can think of. From bioinformatics and computational biology, to administrative data analysis and natural language processing, through internet-of-things and wearable data, to machine learning and artificial intelligence, and even public health and epidemiology. R has it all.
-
Here are the main reasons we love R:
-
R is versatile and powerful - use it for
– graphics;
– all the statistical tests you can dream of;
– machine learning and deep learning;
– automated reports;
– websites;
– and even books;
- R scripts can be reused - gives you efficiency and reproducibility. It is free to use by anyone, anywhere.
Help, what's script?
A script is a list of instructions. It is just a text file and no special software is required to view one. An example R script is shown in the figure below.
Don’t panic! The only thing you need to understand at this point is that what you’re looking at is a list of instructions written in the R language.
You should also notice that some parts of the script look like normal English. These are the lines that start with a # and they are called “comments”. We can (and should) include these comments in everything we do. These are notes of what we were doing, both for colleagues as well as our future selves.
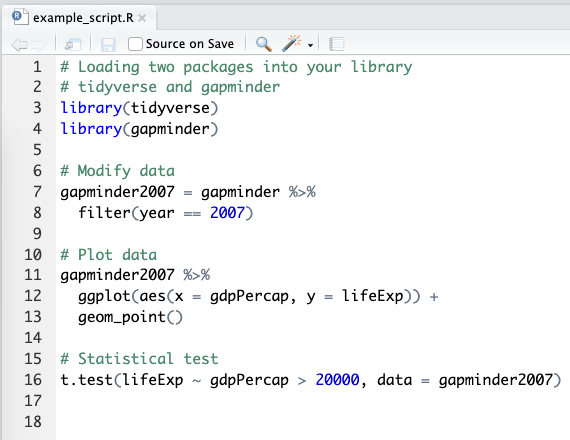
An example R script from RStudio.
Lines that do not start with # are R code. This is where the number crunching really happens. We will cover the details of this R code in the next few modules. The purpose of this module is to describe some of the terminology as well as the interface and tools we use.
For the impatient:
- We interface R using RStudio
- We use the tidyverse packages that are a substantial extension to base R functionality (we repeat: extension, not replacement)
Example R code section (to test formatting)
library(tidyverse)
library(gapminder)
gapminder2007 = gapminder %>%
filter(year == 2007)
gapminder2007 %>%
ggplot(aes(x = gdpPercap, y = lifeExp)) +
geom_point()